Dividends Timeline

Overview
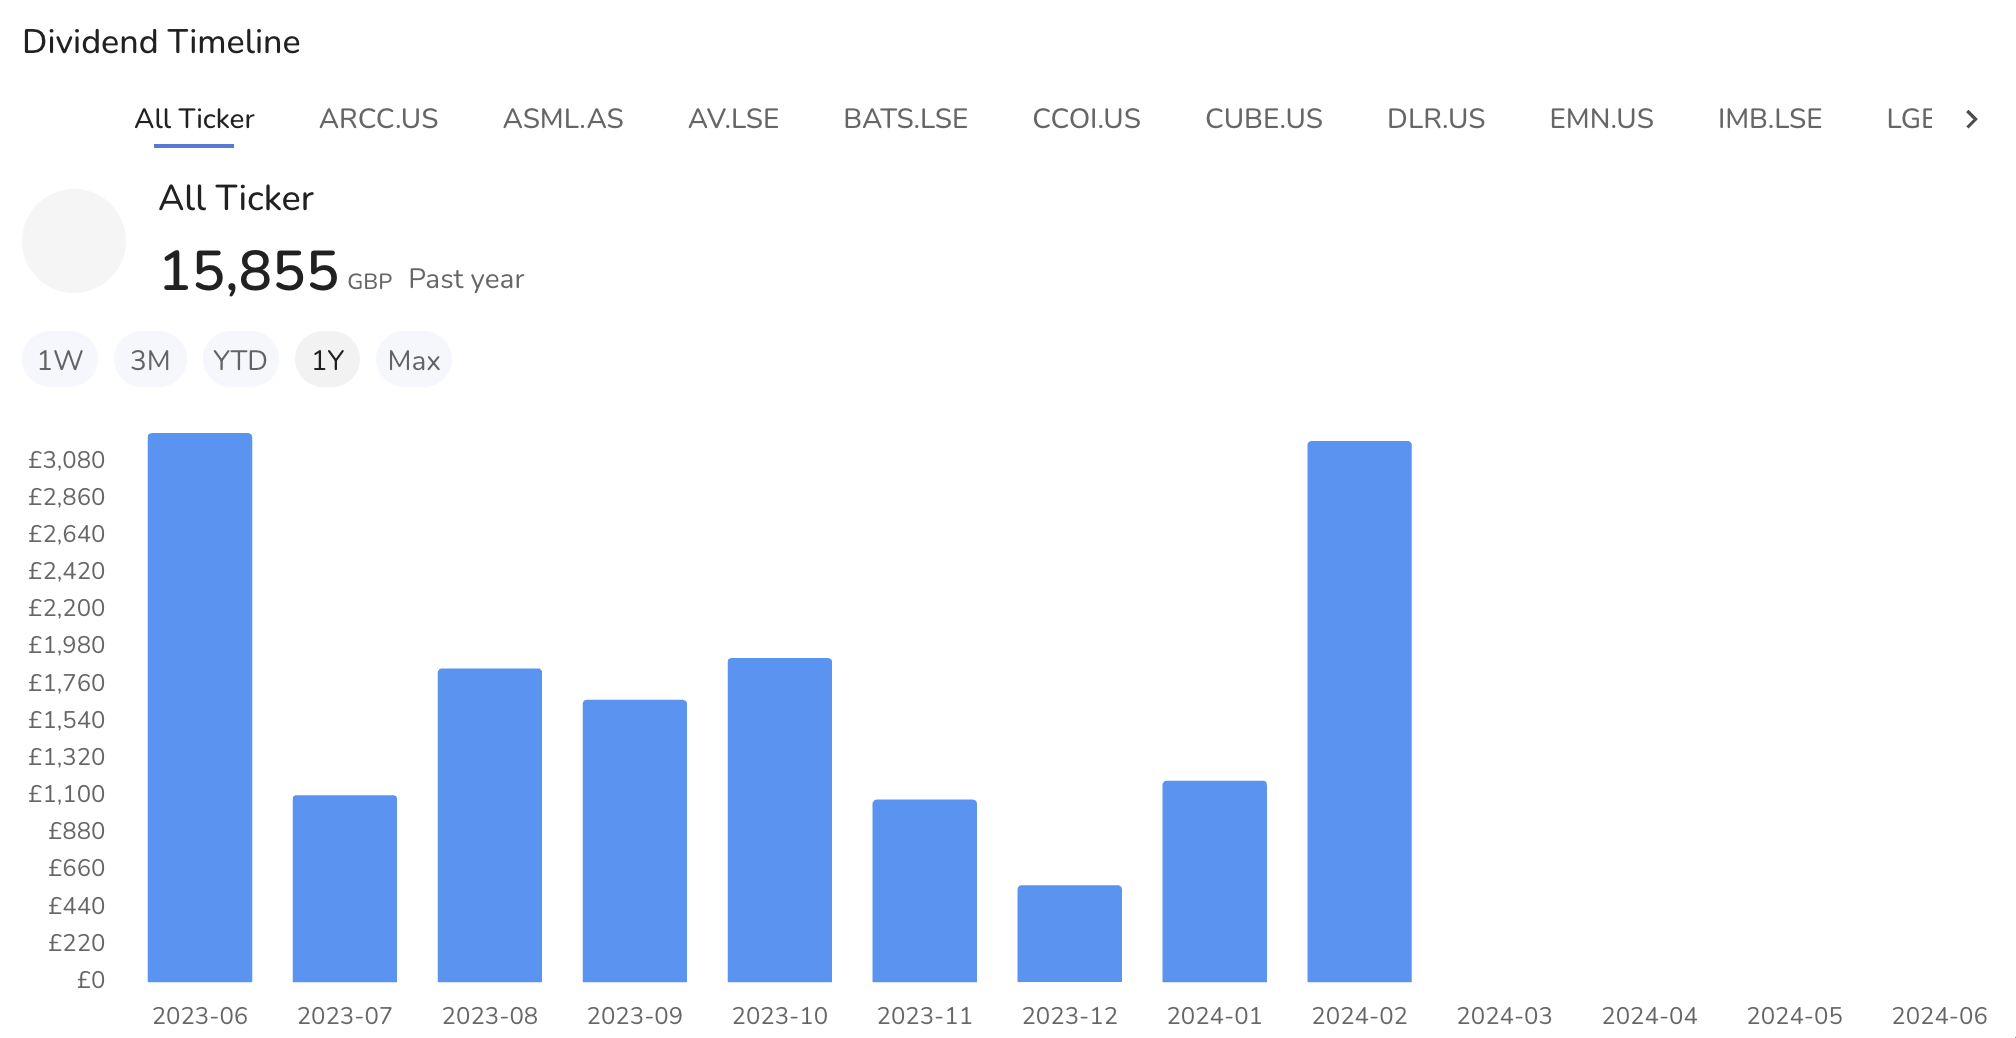
The Dividends Timeline Widget displays the past dividends paid to you over a selected time interval. You can view the total dividends for all tickers or choose a specific ticker to see its dividend history. This widget provides a clear visualization of your dividend income over time, helping you analyze your investment returns.
Data Displayed
- Dividend Payments: This figure shows the total amount of dividends received within the selected time period. It helps you track your income from dividends over different time intervals.
Settings
- Accessing Settings:
- Click on the settings icon to open the settings menu.
- General Settings:
- Display Past Holdings: Toggle this setting to include or exclude past holdings in the dividend calculations.
- Show header: Toggle this setting to show or hide the header.
- Show label: Toggle this setting to show or hide labels on the chart.
- Saving Changes:
- After entering all the necessary information, click "Save" to apply your changes.
- Buttons:
- Default: Resets the settings to default values.
- Cancel: Discards any changes made.
- Save: Applies and saves the changes.